How to Enable Monitoring
Monitoring is disabled by default. The observability platform requires dedicated resources to process and store data, so you can choose the right monitoring plan size for your needs and enable it only for the workloads that require it.
To access the Log and Request Browsers, an Admin must enable Monitoring at the Resource Group (Team) level, and collection must be toggled on for the individual Landscape.
Info: Only Resource Group (Team) admins can enable the monitoring platform.
Turning on Monitoring for the Resource Group (Team)
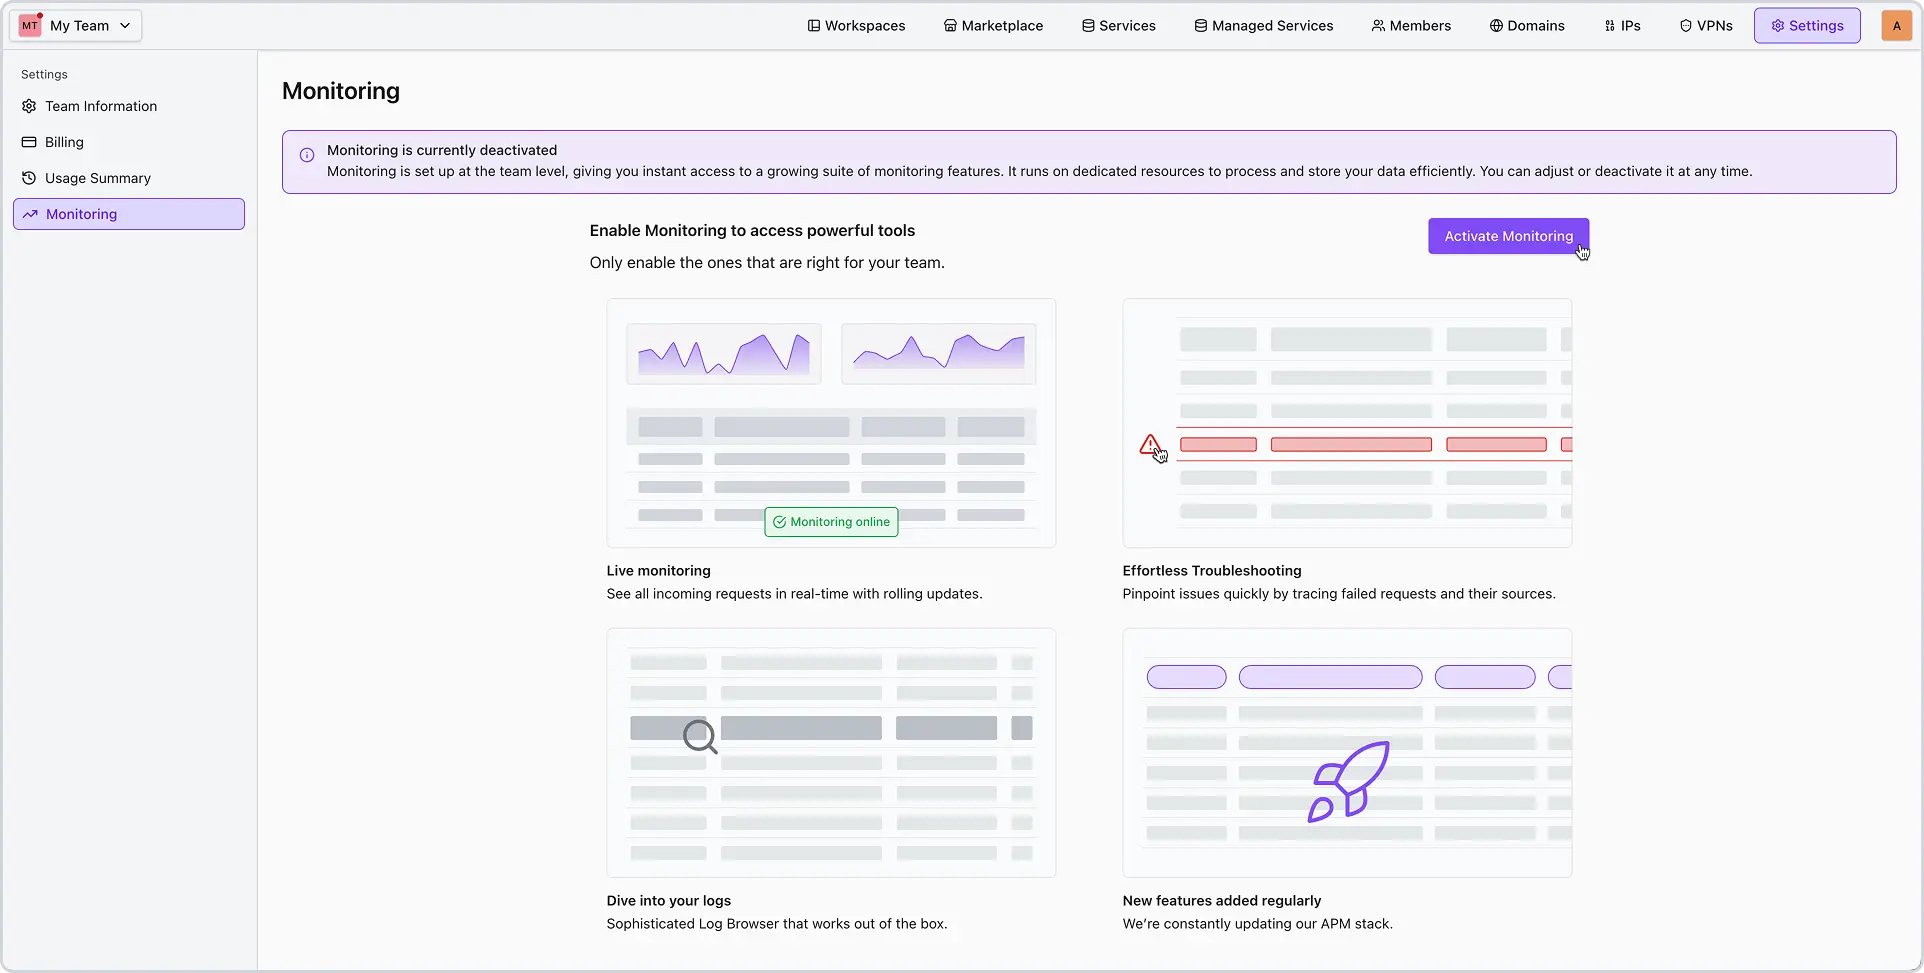
- Navigate to the Settings area, and then to the Monitoring tab.
- Click “Active Monitoring”.
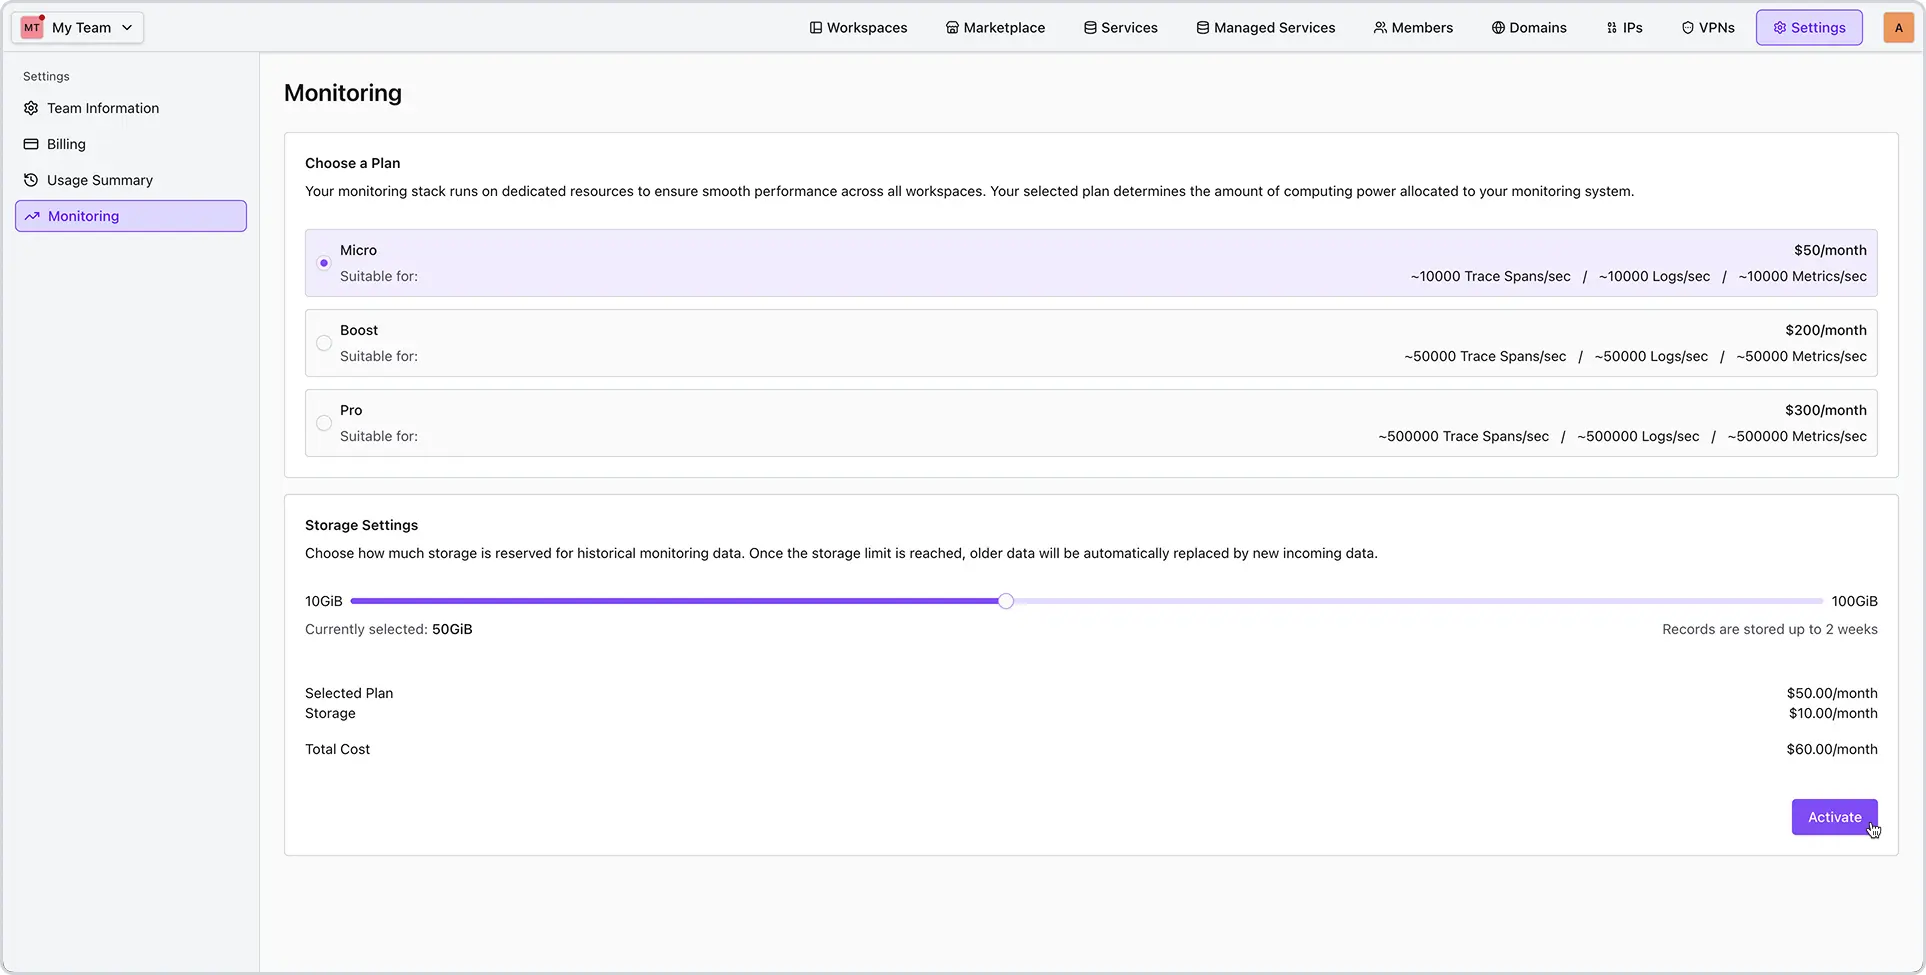
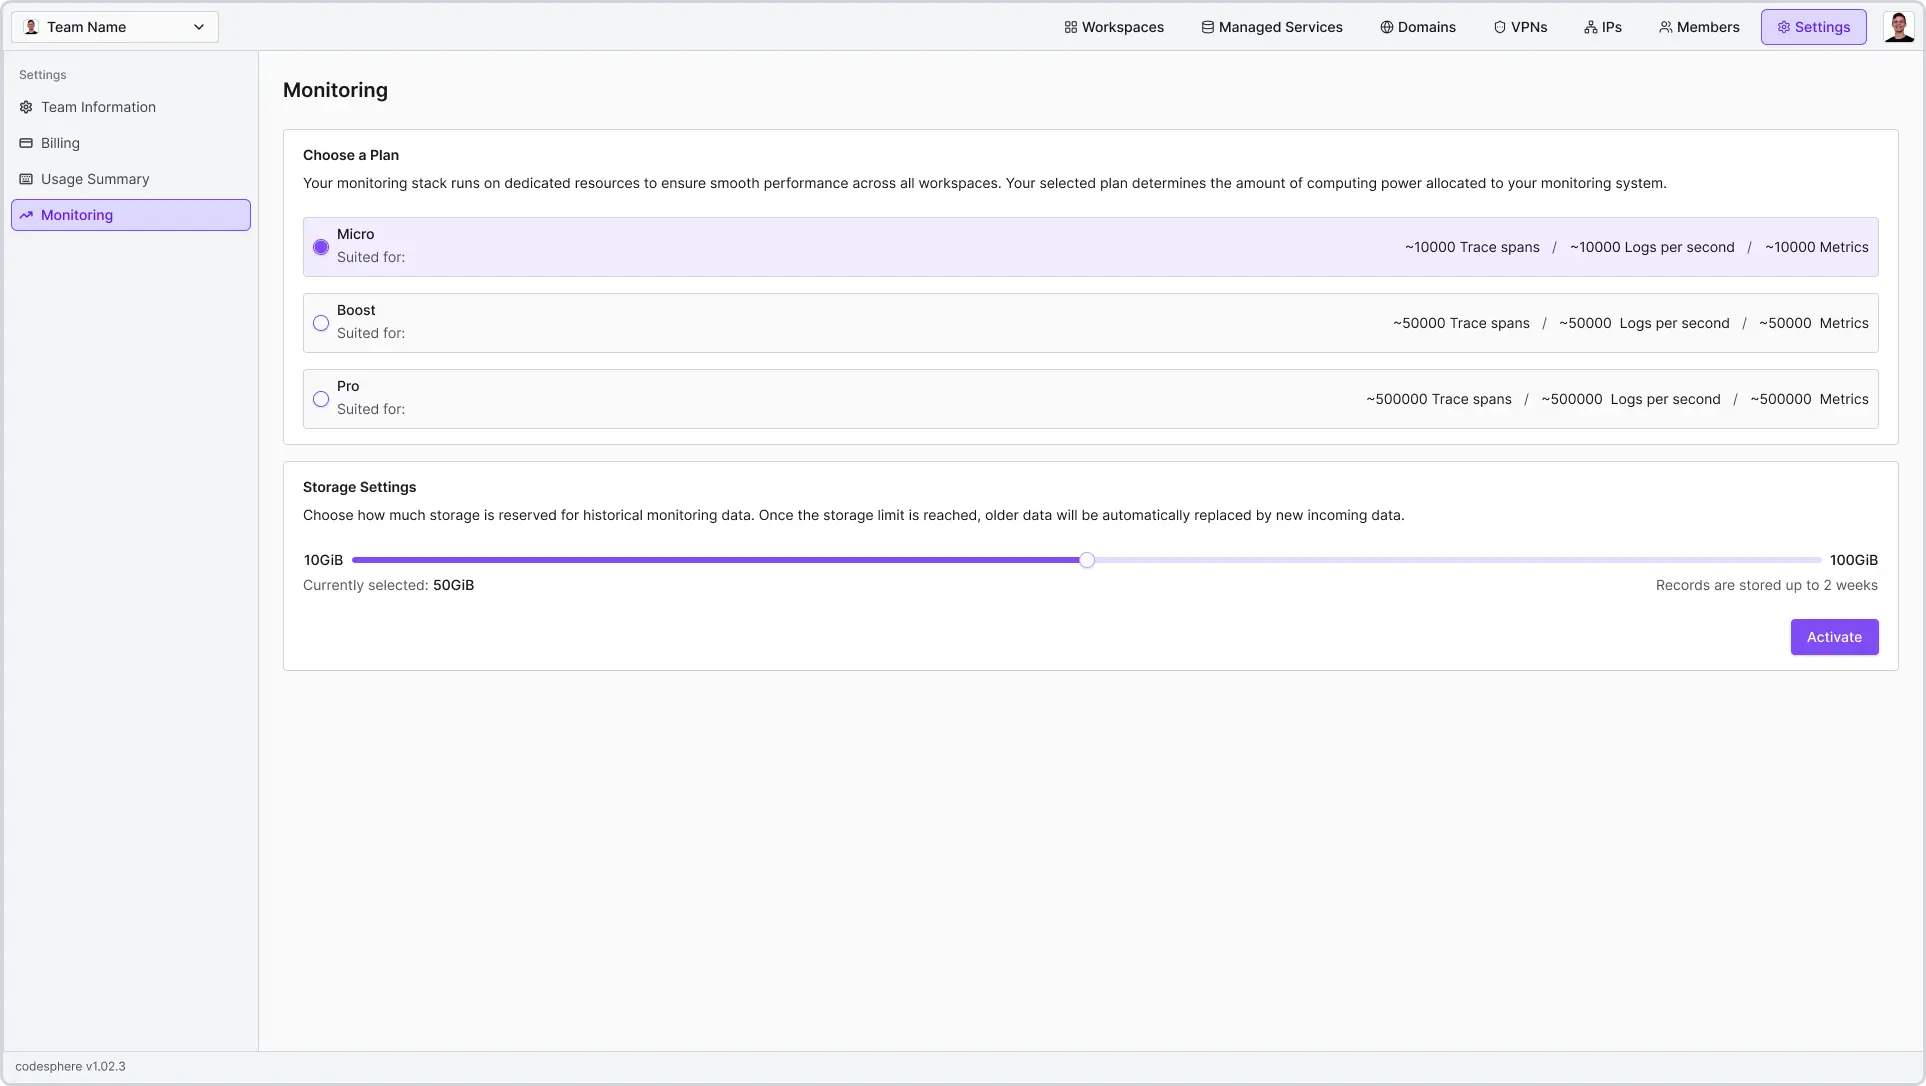
- Choose your desired plan for the Monitoring service and activate it.
Enabling Log & Request (Trace) Collection in the Landscape
Now that monitoring is active for the Resource Group (Team), you must specifically enable collection for each Landscape.
Why is this step necessary?
This setting gives you precise control over your observability data. You can decide exactly which workloads send logs and traces to the monitoring platform, ensuring that you're only paying for and storing the data you actually need.
Tip: We recommend enabling both logs and traces to get the most out of the Codesphere Observability Stack.
Steps to Enable:
- Public Cloud Installations
- Private Cloud Installations
Note on Billing: Uses usage-based billing specifically for the monitoring resources consumed.
- Go to Settings > Monitoring. Click Active Monitoring.
- Select your preferred plan and storage settings, then activate it.
Note on Billing: Monitoring consumes resources directly from your existing pool of compute and licenses.
- Go to Settings > Monitoring. Click Active Monitoring.
- Select your preferred plan and storage settings, then activate it.
Note: For private cloud installations, additional configuration may be required. Please refer to the Private Cloud Installation Guide or contact your Codesphere administrator.