Codesphere Request Browser
The Request Browser centralizes real-time data on response codes, latency, traffic paths, and request traces, allowing you to move from "something is wrong" to a root-cause fix quickly. Use this guide to master the interface, filter for performance bottlenecks, and audit your traffic flow.
How to Enable the Request Browser
The Request Browser is not enabled by default. To get started using it, monitoring first needs to be enabled in both the Resources Group (Team) and in each individual Landscape where you want to use it.
For help with this, please refer to our How to Enable Monitoring article.
info
Only Resource Group (Team) admins can enable monitoring.
Architectural Overview

Corresponding accessible text description
Using the Request Browser
What Does the Request Browser Record?
Request logs track every external interaction with your application's public endpoint:
- Key Metrics: Inspect and understand critical request details including end-to-end latency (response time), HTTP status code (200, 404, 500), and the resource path accessed.
- User Traceability: Correlate specific requests with user sessions or client IP addresses for targeted debugging and identifying problematic traffic sources.
Data Retention and Storage
- Retention Window: Traces are retained for 14 days. After this period, data is automatically purged.
- Storage Limits: Trace storage is subject to a space quota. If your allocated space is exceeded, the oldest logs will be automatically overwritten to make room for new incoming traffic.
warning
Disabling monitoring at the Resource Group (Team) level triggers an immediate, permanent deletion of all historical logs for that group. This action cannot be undone.
Common Use Cases
- API Performance Audit: Filter logs to show only requests to your
/apiendpoints with latency greater than 500ms to identify performance regressions after a deployment. - Traffic Validation: Verify that Path-Based Routing rules are correctly distributing incoming traffic to the intended services (e.g., all traffic to
/docsgoes to the static service).
Request logs are vital for non-application-level debugging:
- Error Diagnosis: Quickly identify and analyze patterns in failed 4xx (client) and 5xx (server) responses to pinpoint configuration or application issues. (See:
network-and-connection-issues.md) - Performance Bottlenecks: Identify slow requests (high latency) to narrow down API endpoints that require optimization.
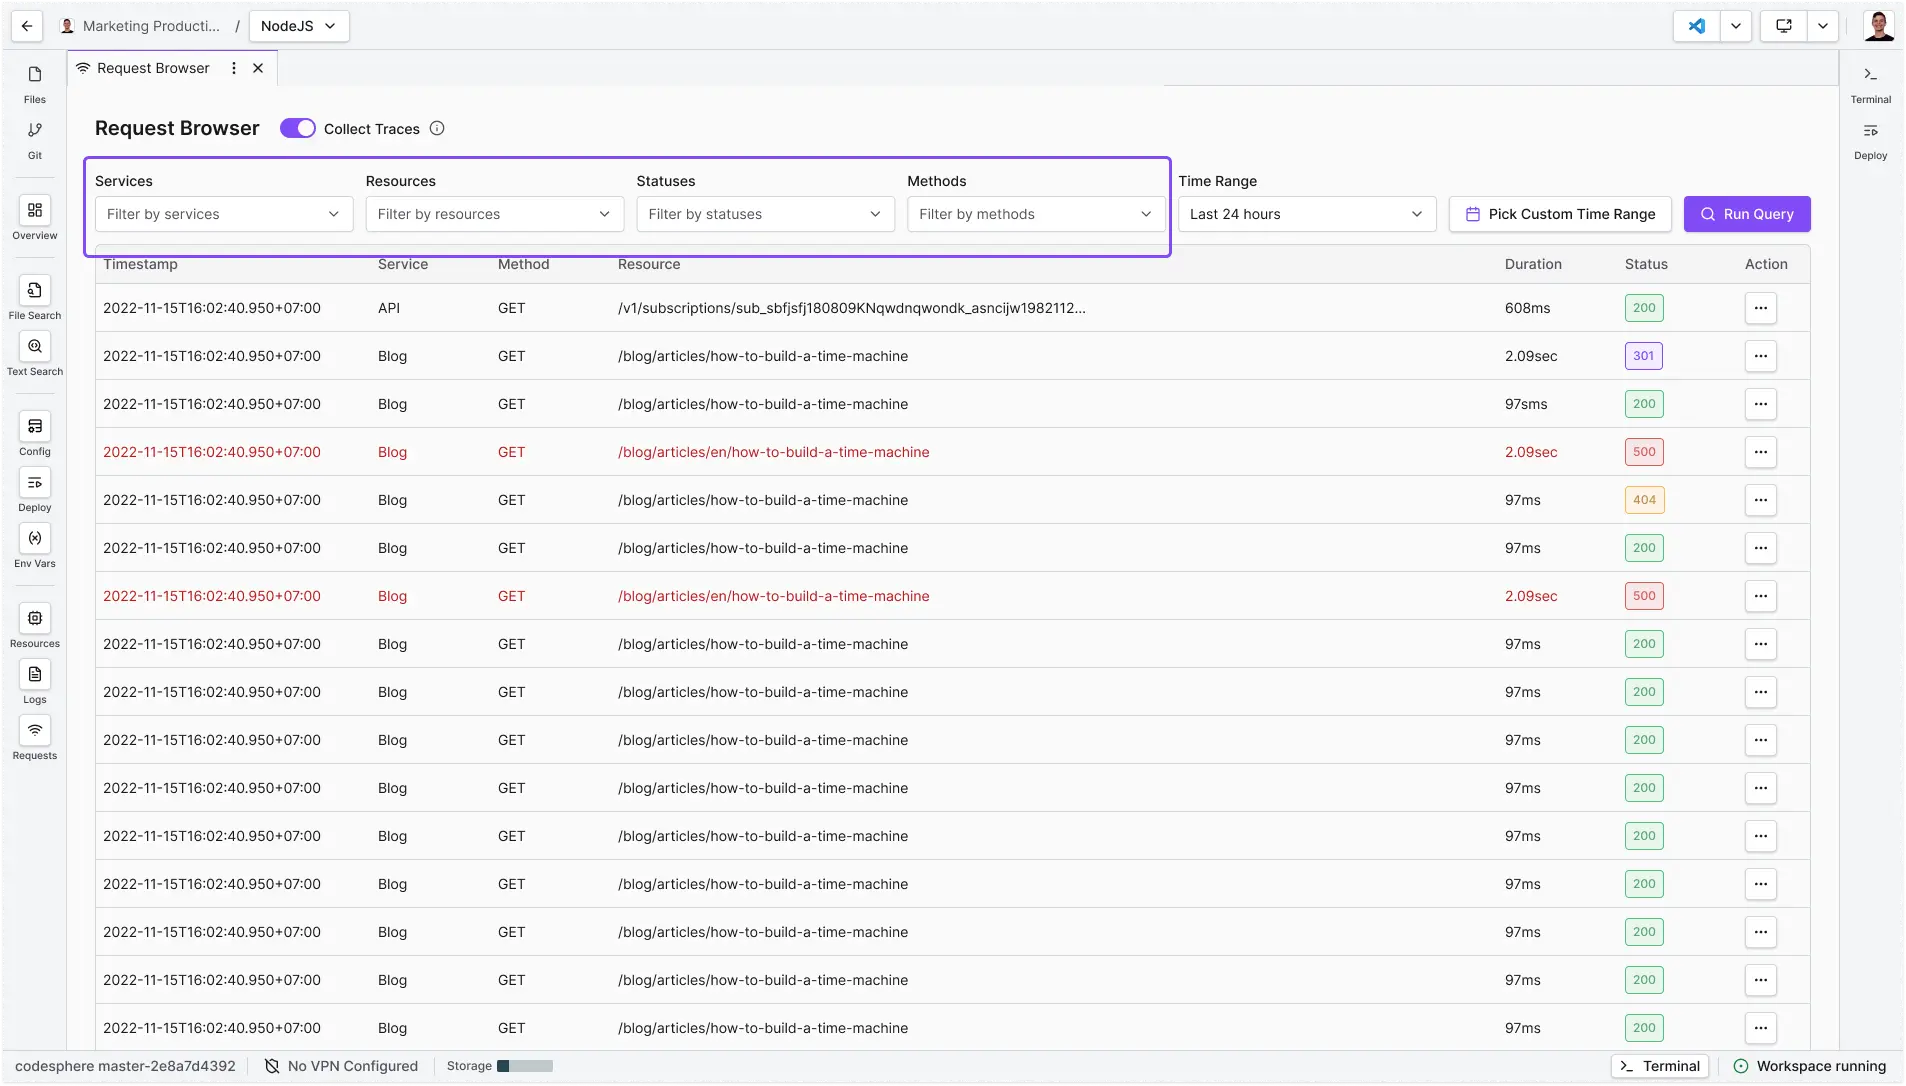
The Request Browser at a Glance
Timestamp: The exact time (down to the millisecond) the request was received by the platform.
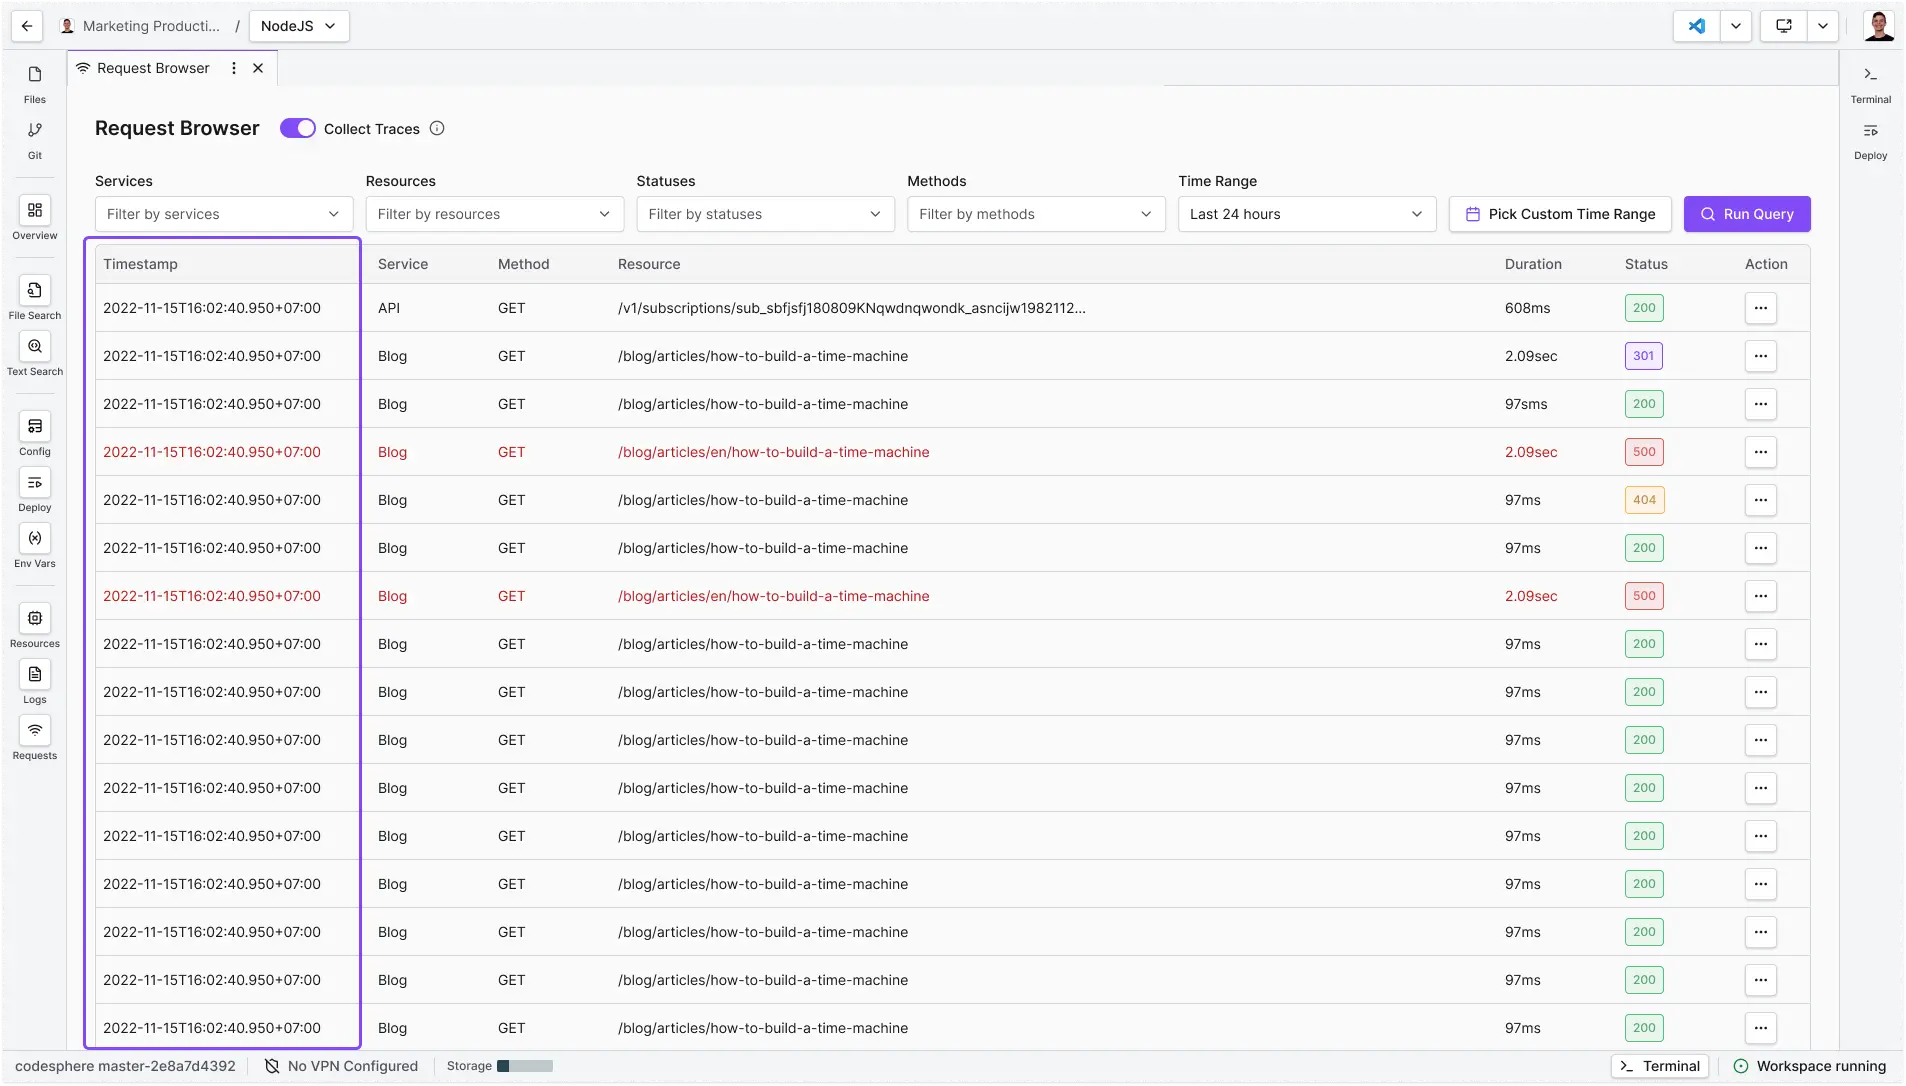
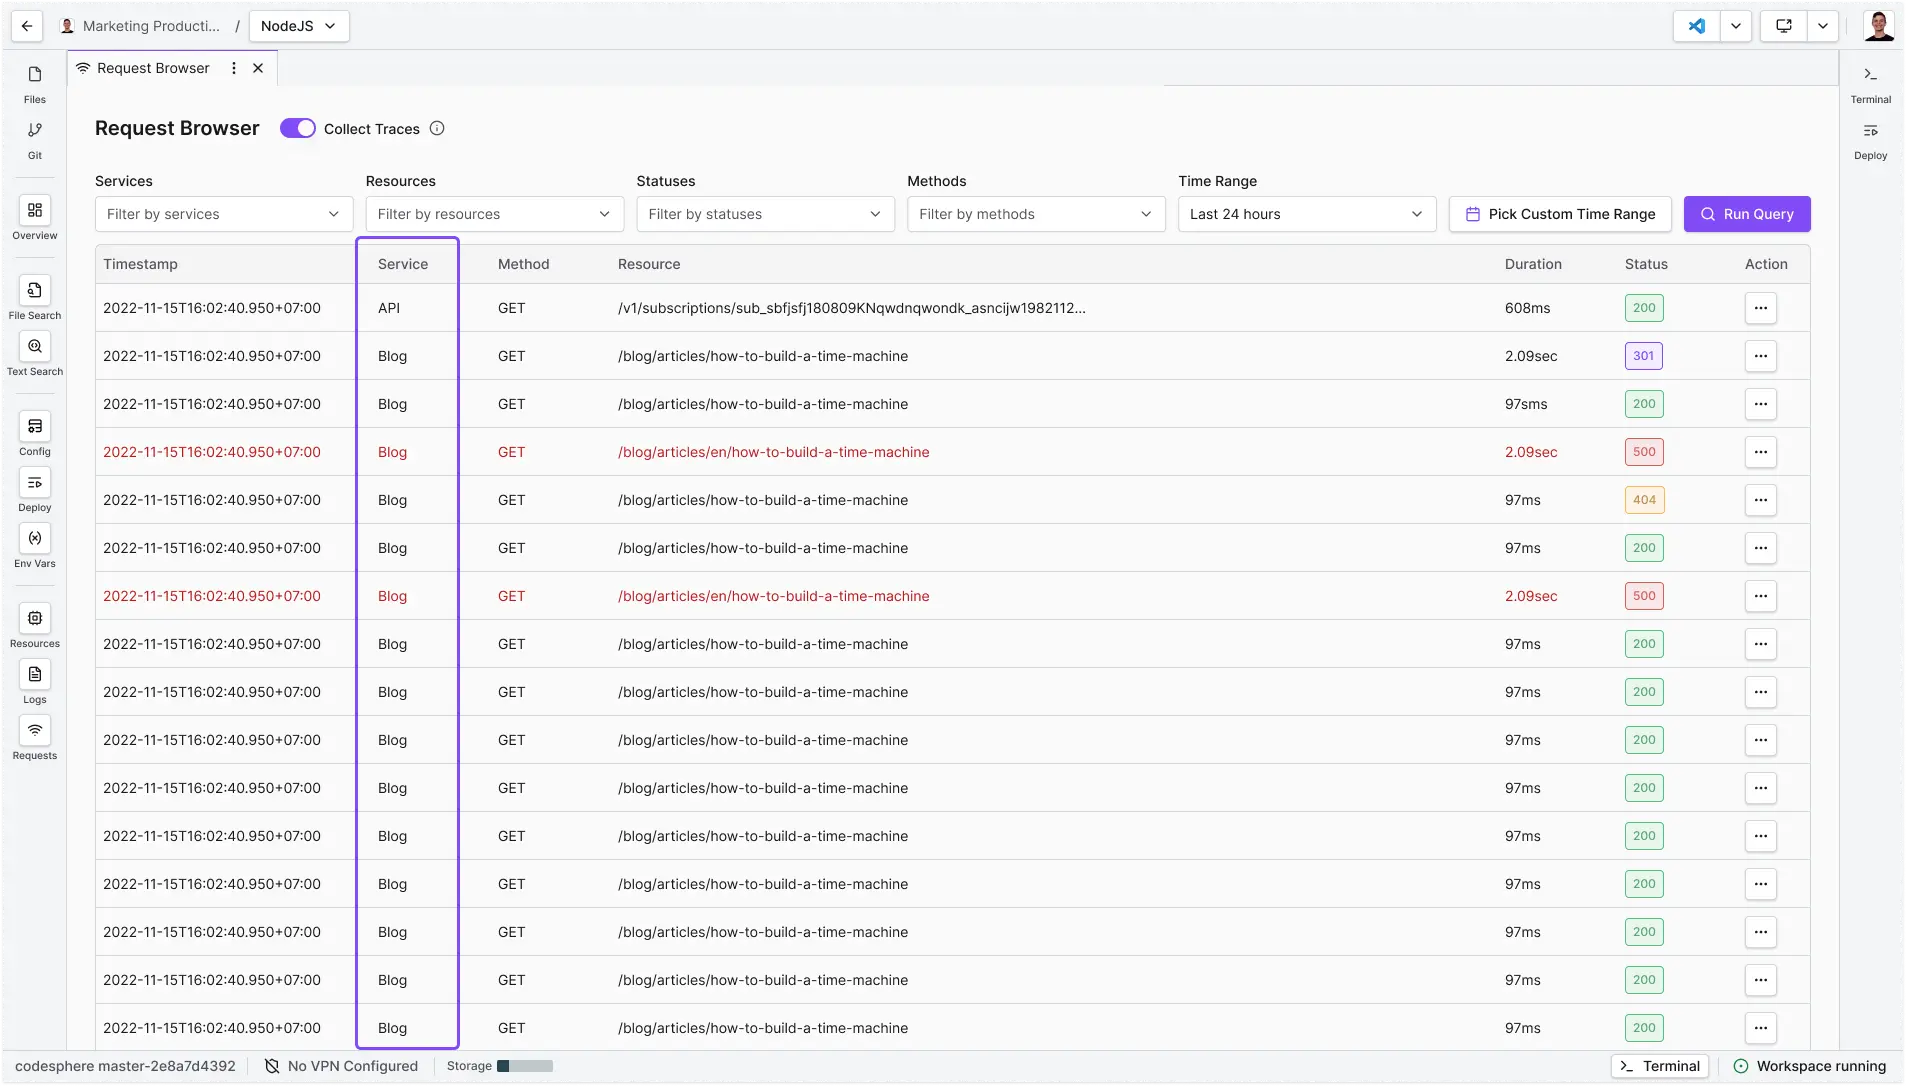
Service: The internal application or component (e.g., api, frontend) that handled the request.
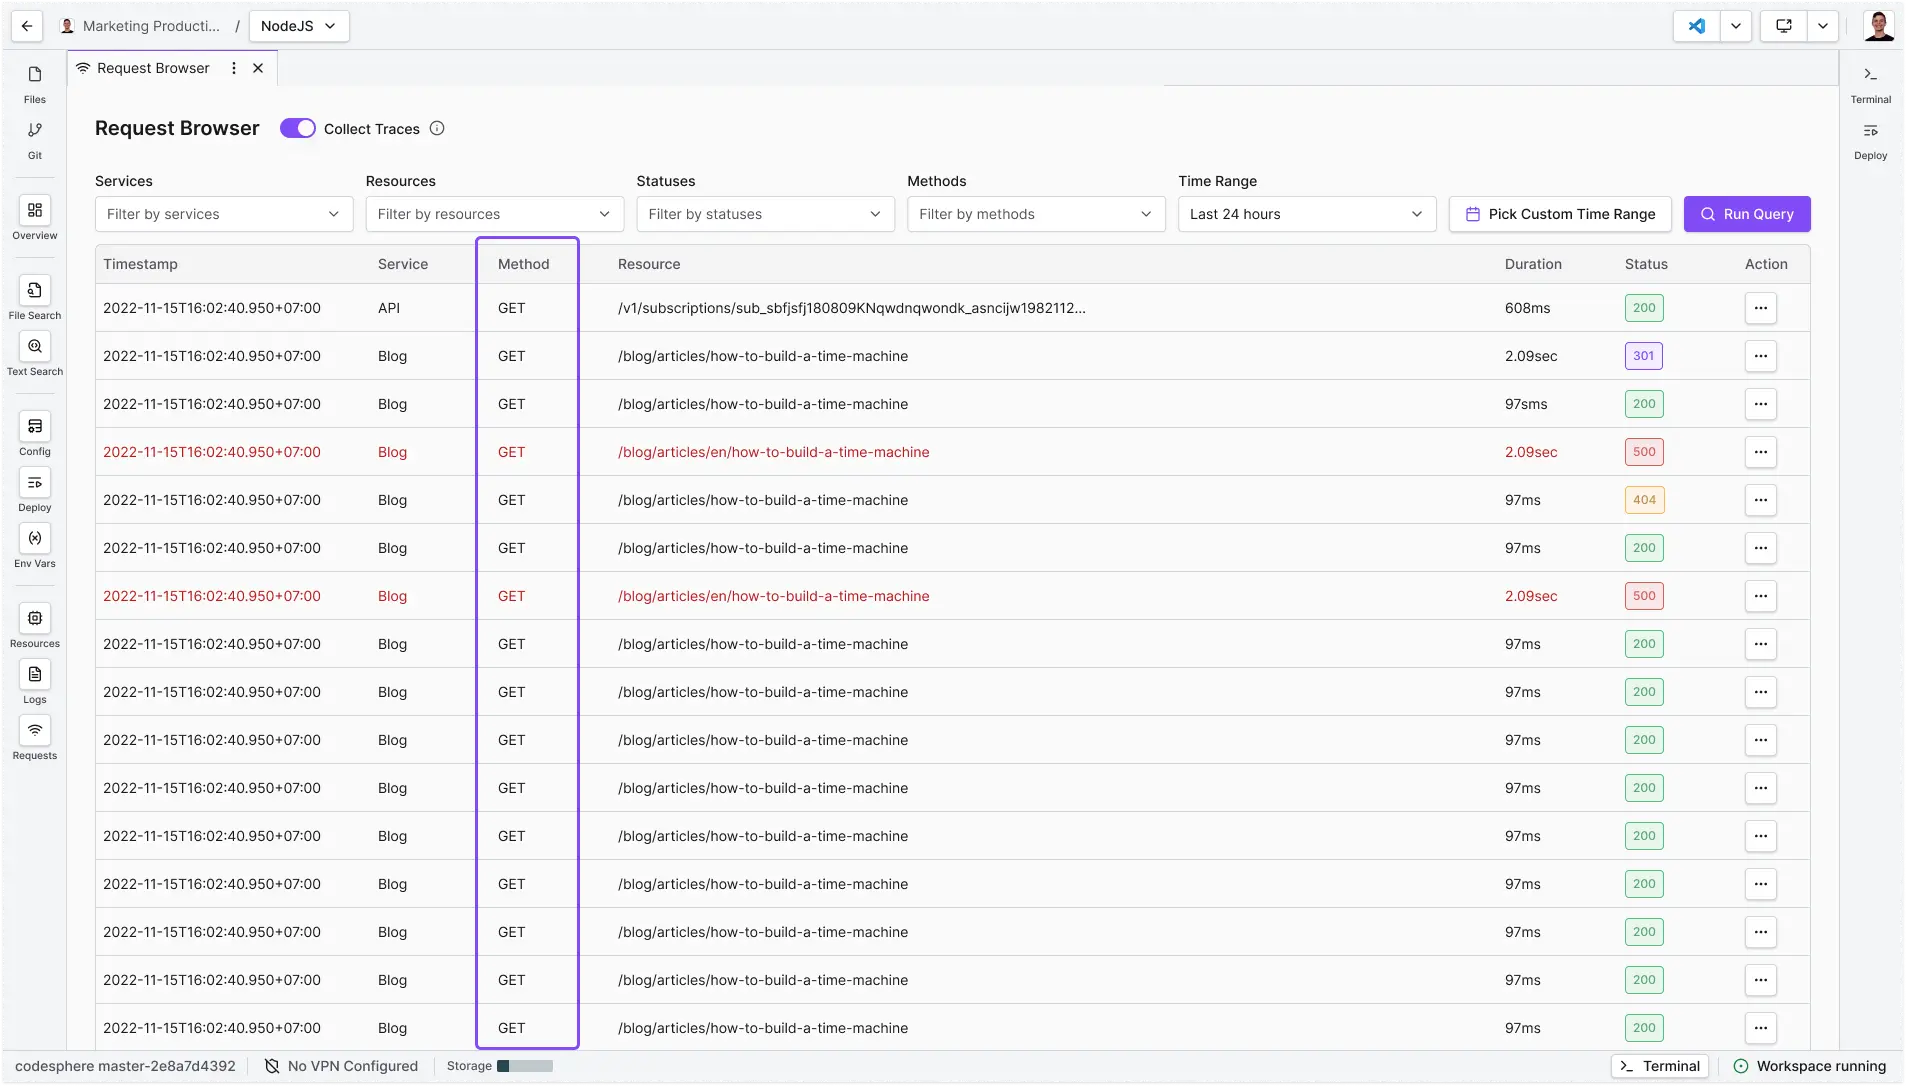
Method: The HTTP verb used (GET, POST, etc.), indicating the nature of the request.
Resource: The specific endpoint or file path accessed (e.g., /shorten or /favicon.ico).
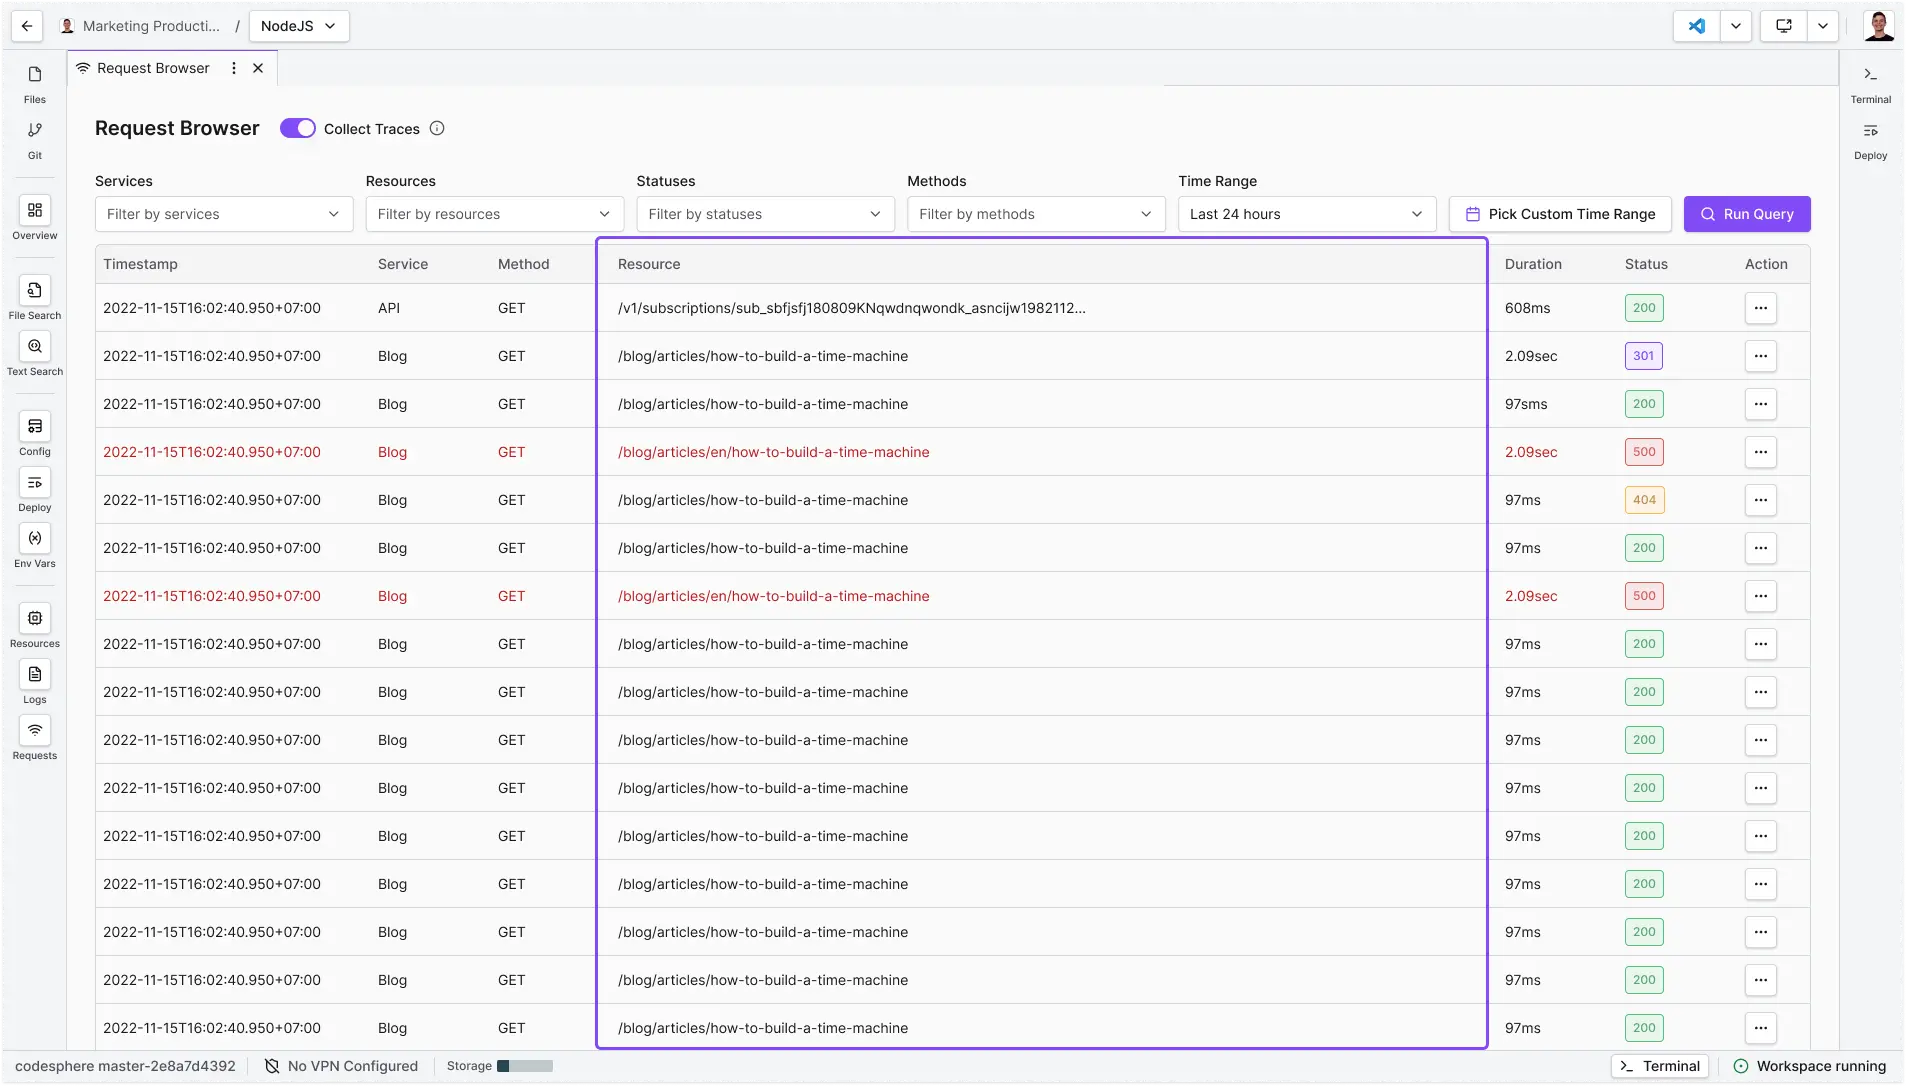
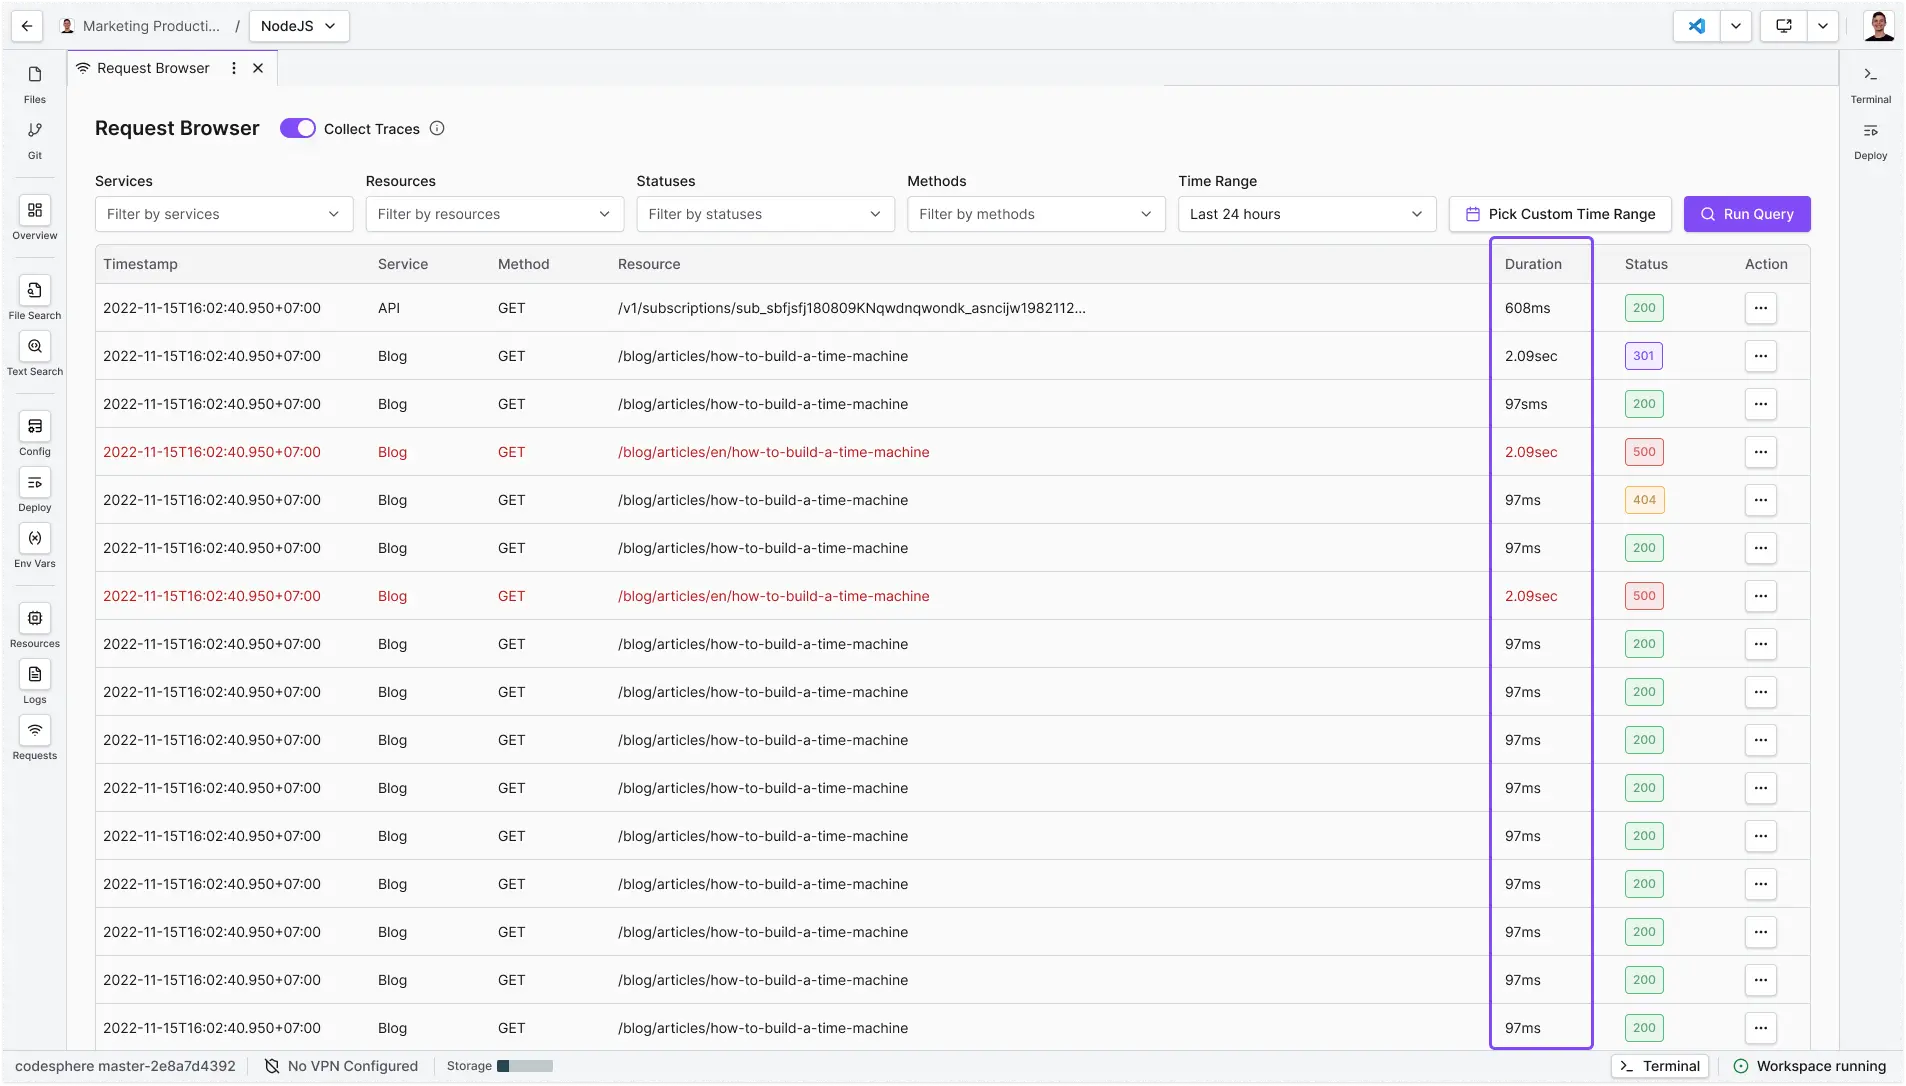
Duration: The total round-trip time in milliseconds (ms) from request to response.
Status: The HTTP response code.
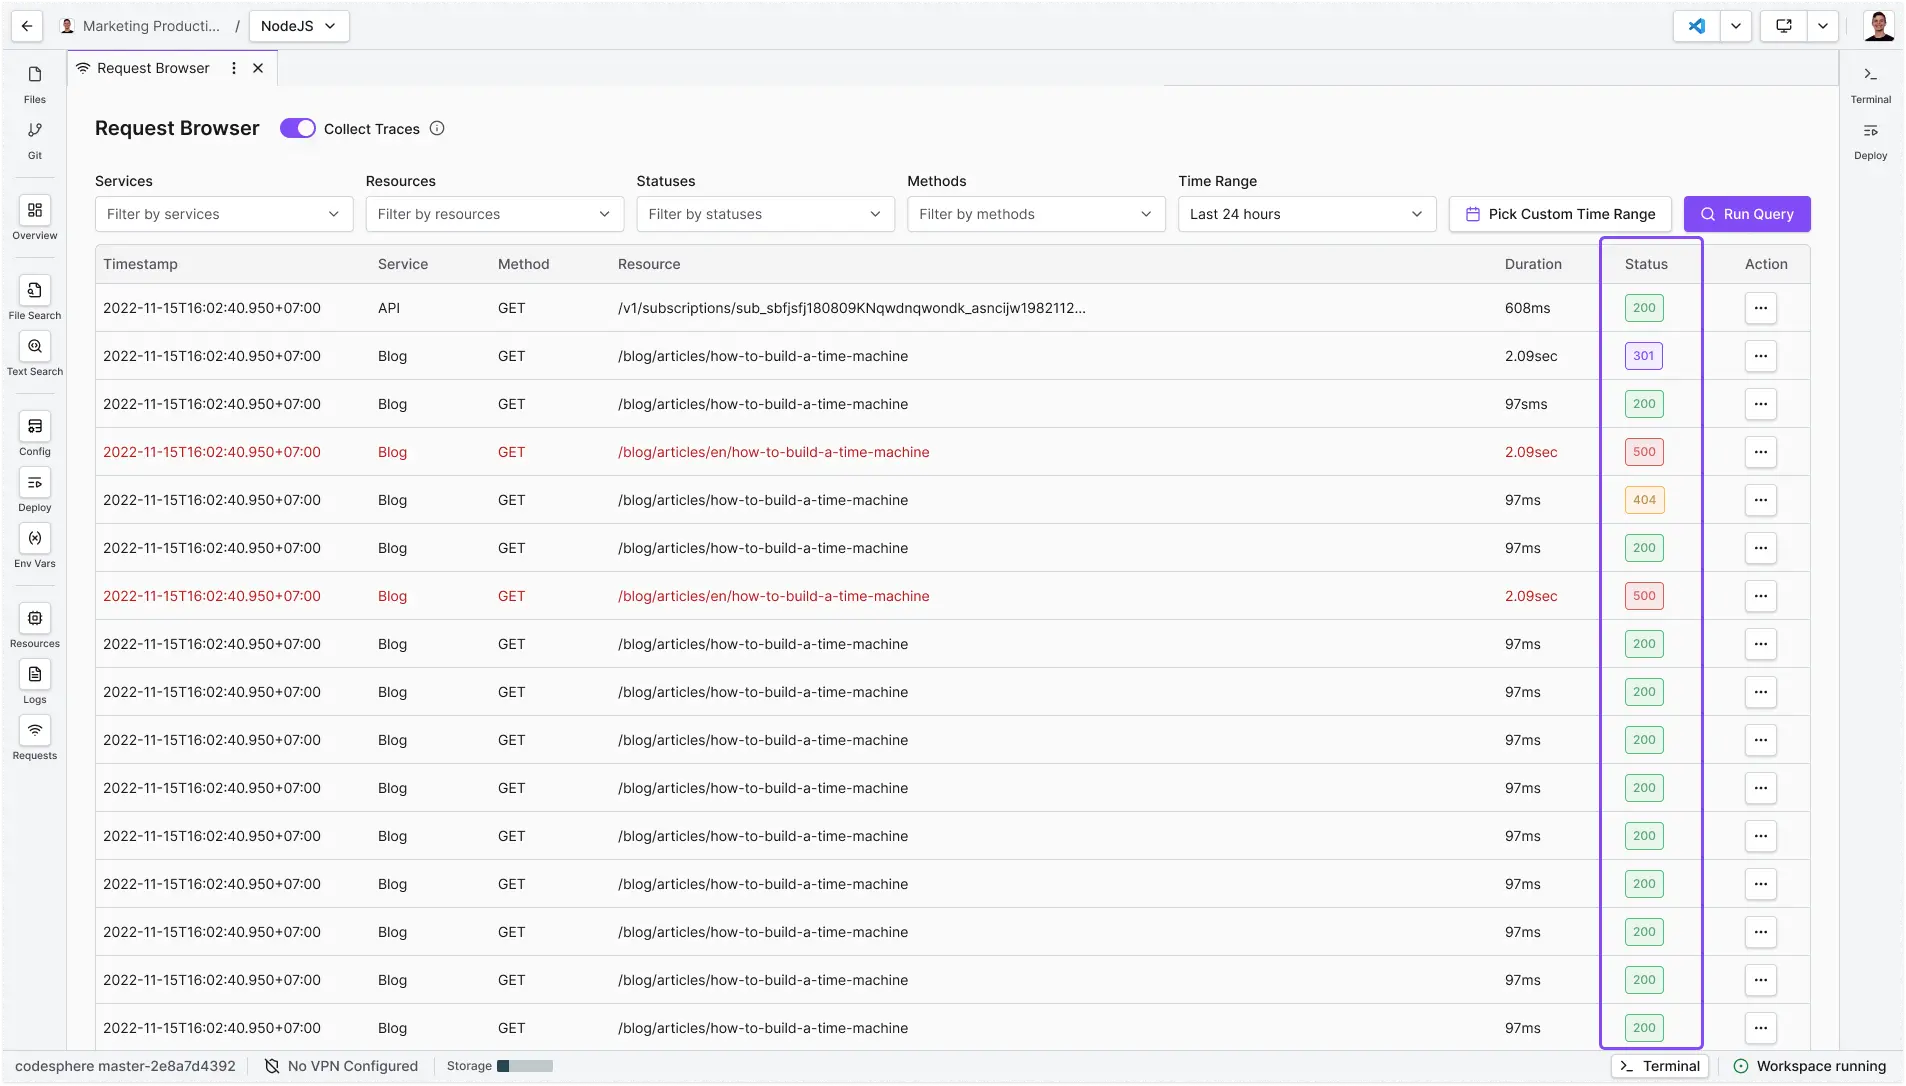
| Severity Code | Meaning |
|---|---|
| 200 | Success |
| 304 | Not modified |
| 404 | Not found |
| 500 | Server error |
| 504 | Gateway timeout |
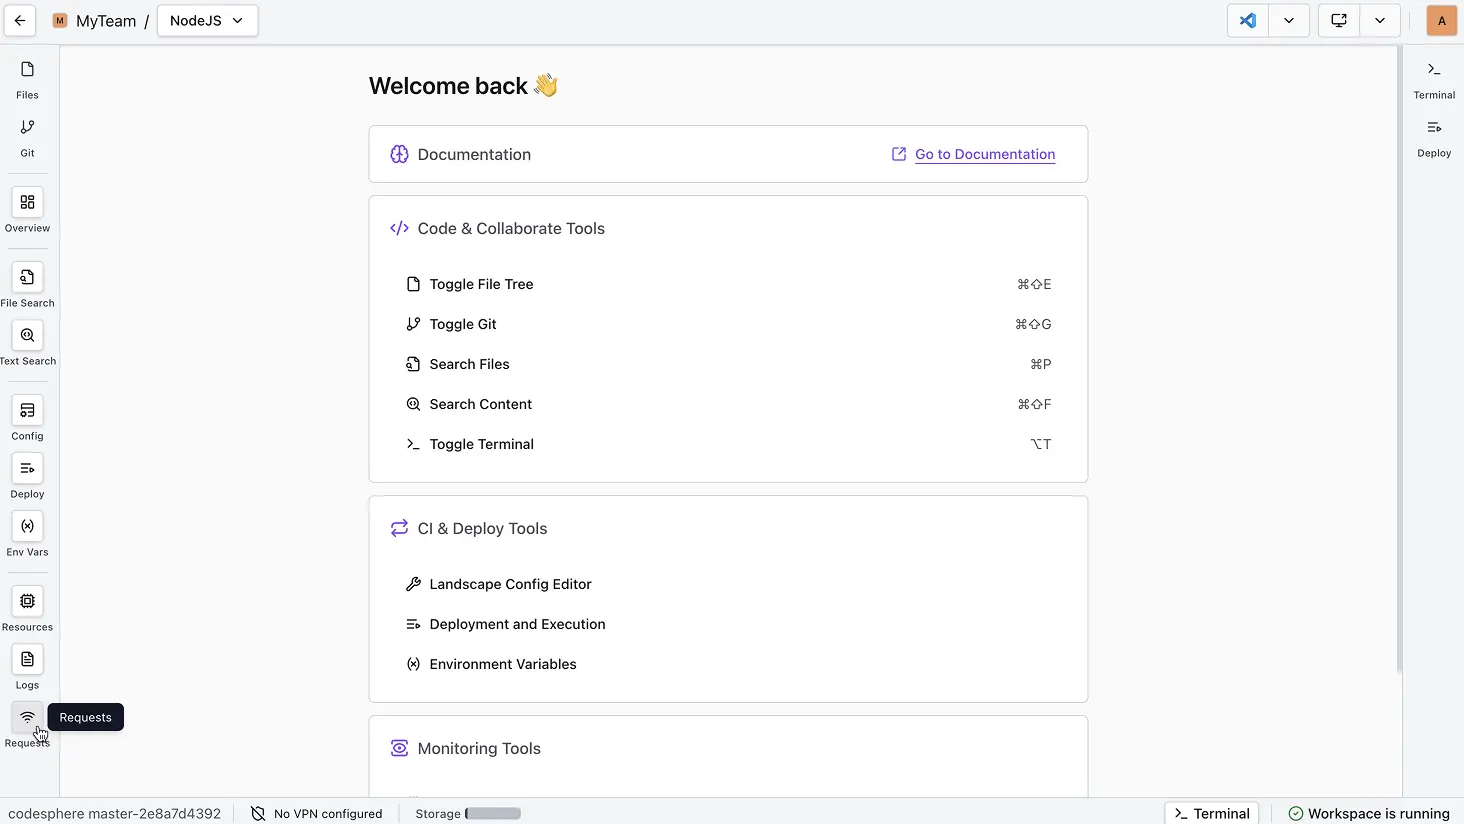
Filtering and Analysis (Step-by-Step)
-
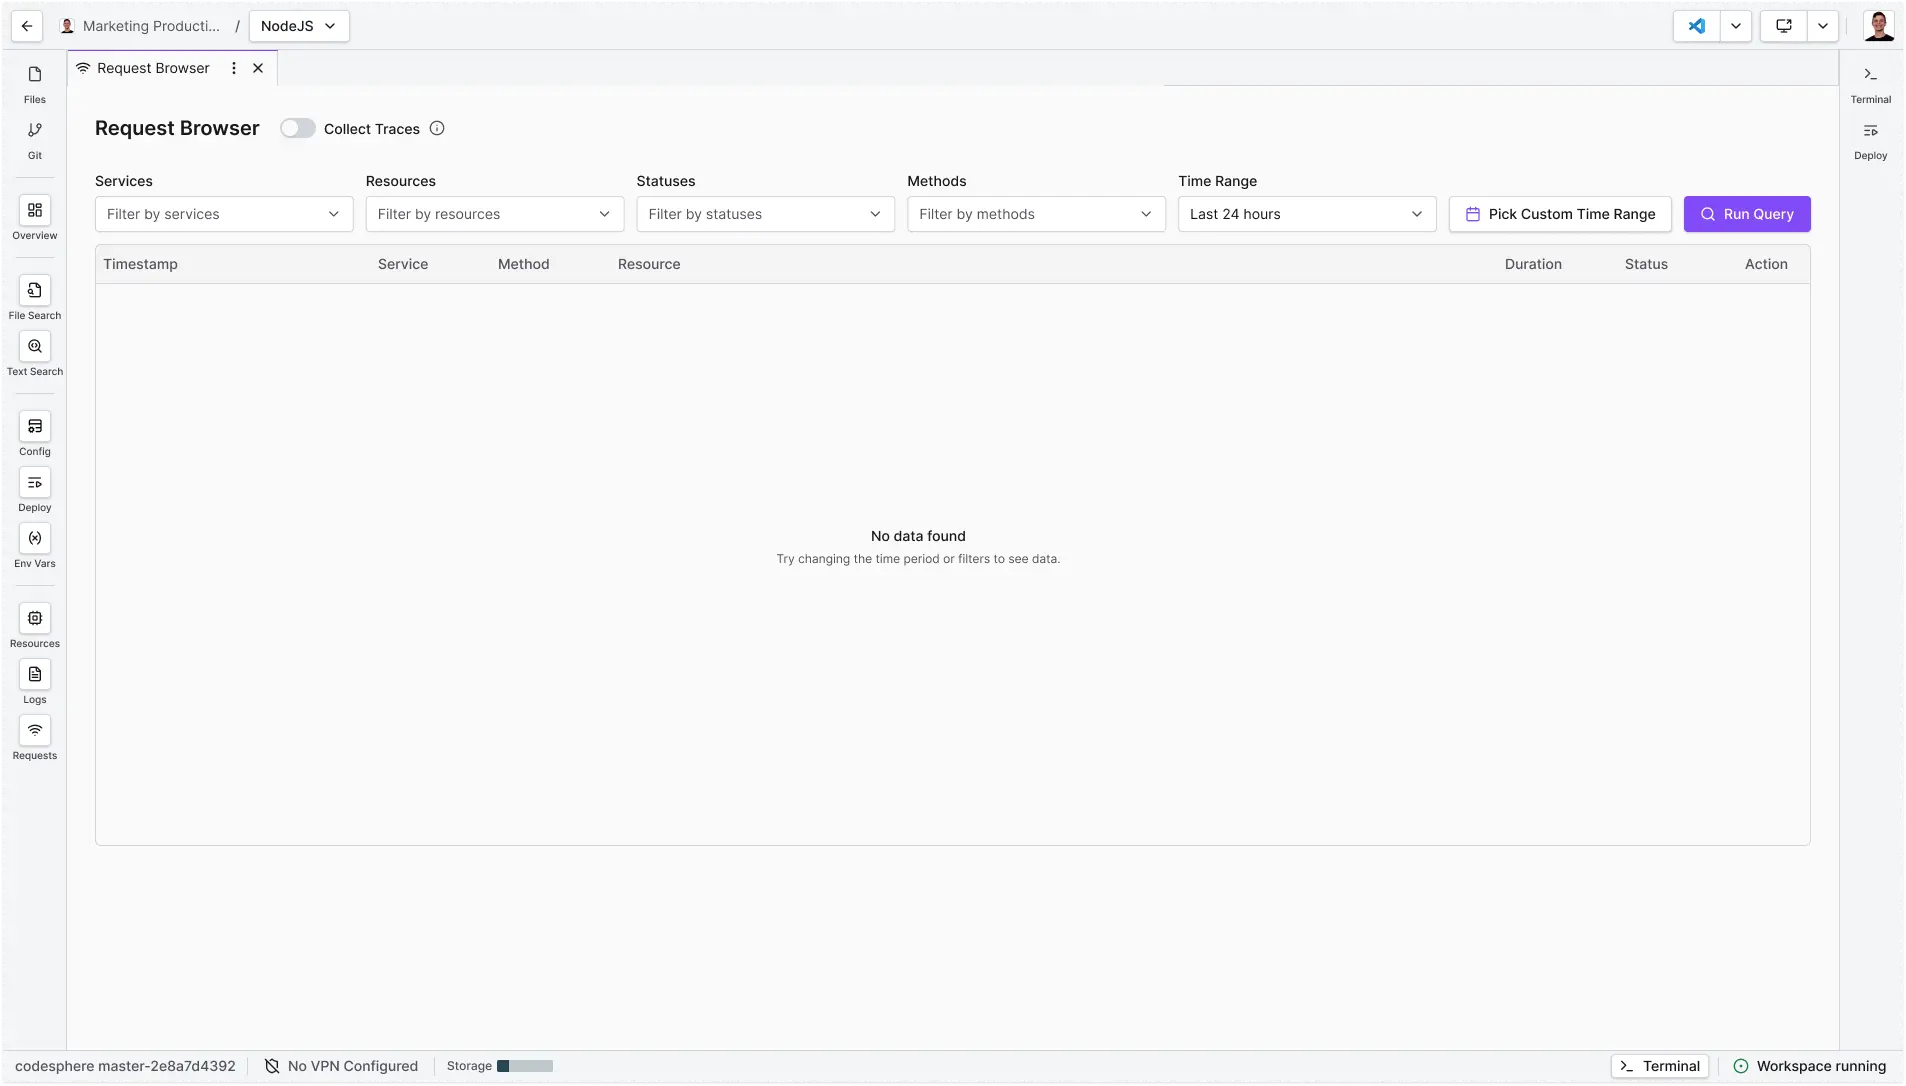
From inside the workspace, click the Request Browser button in the left sidebar.
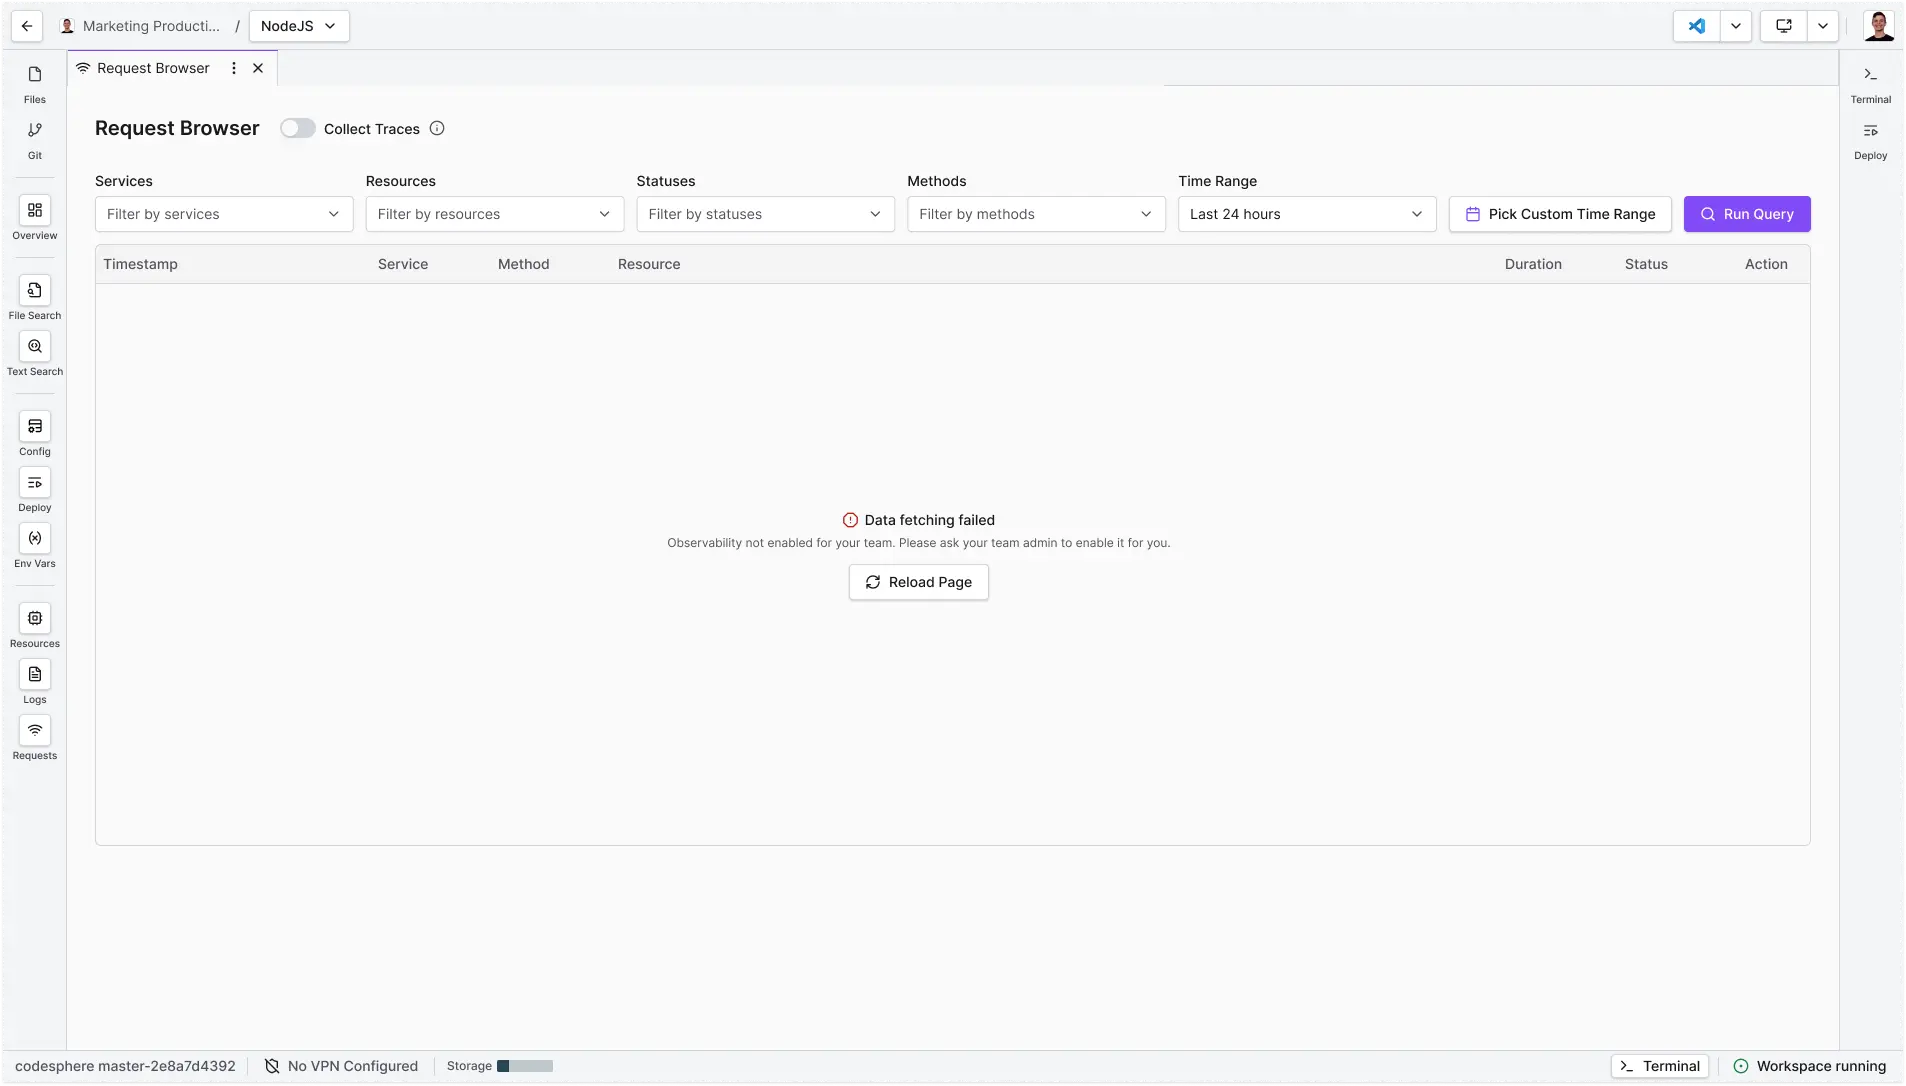
No data showing?
This usually appears when no requests match your criteria. Adjust your filters or select a different time range.
-
Filter by service name, resource, status, or method.
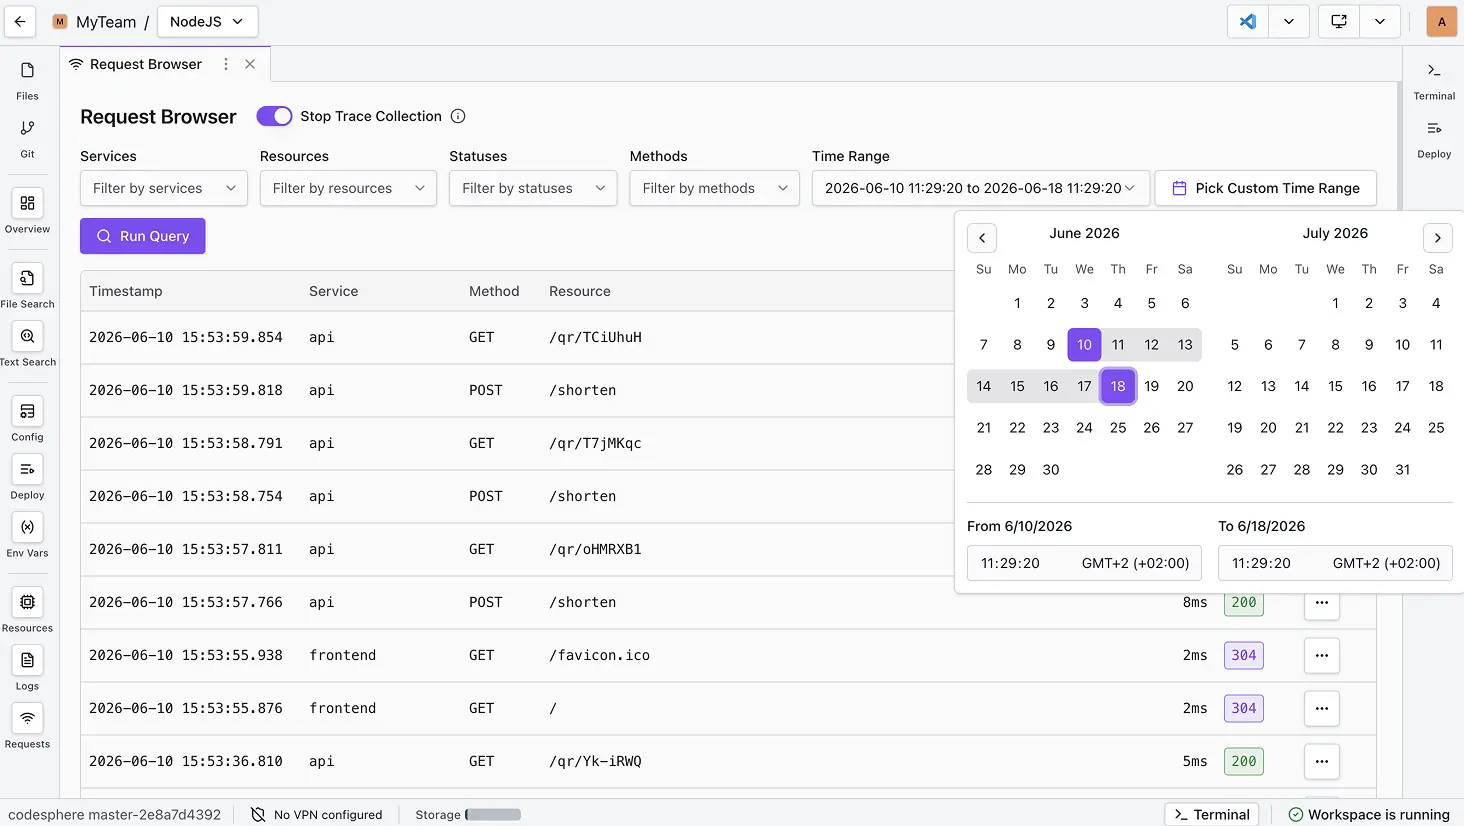
-
Time Filtering: Use the time selector to inspect logs from a specific historical period.
-
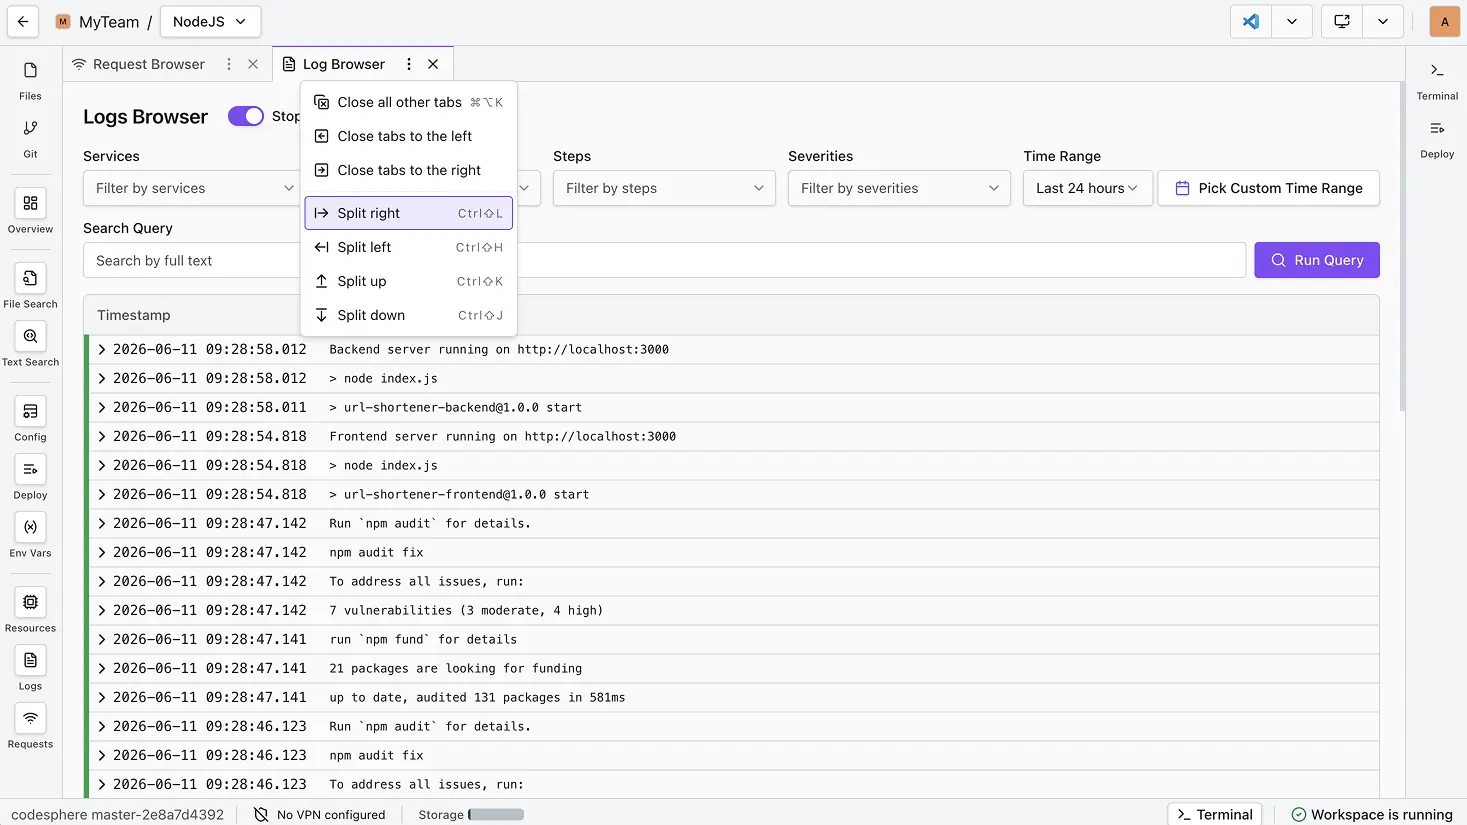
Corresponding Logs: Logs that correspond to the request can easily be swapped to by using the actions button.
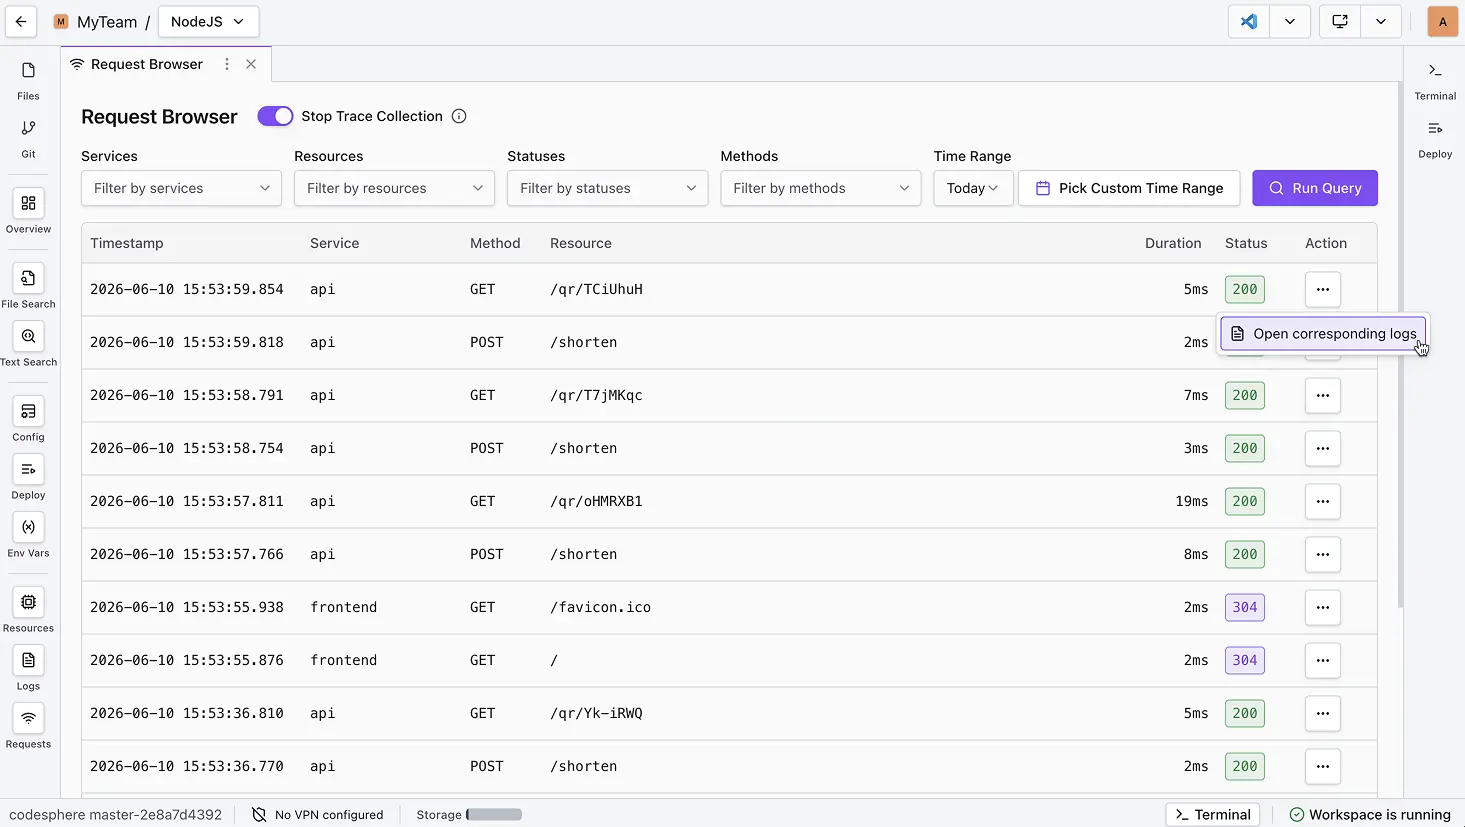
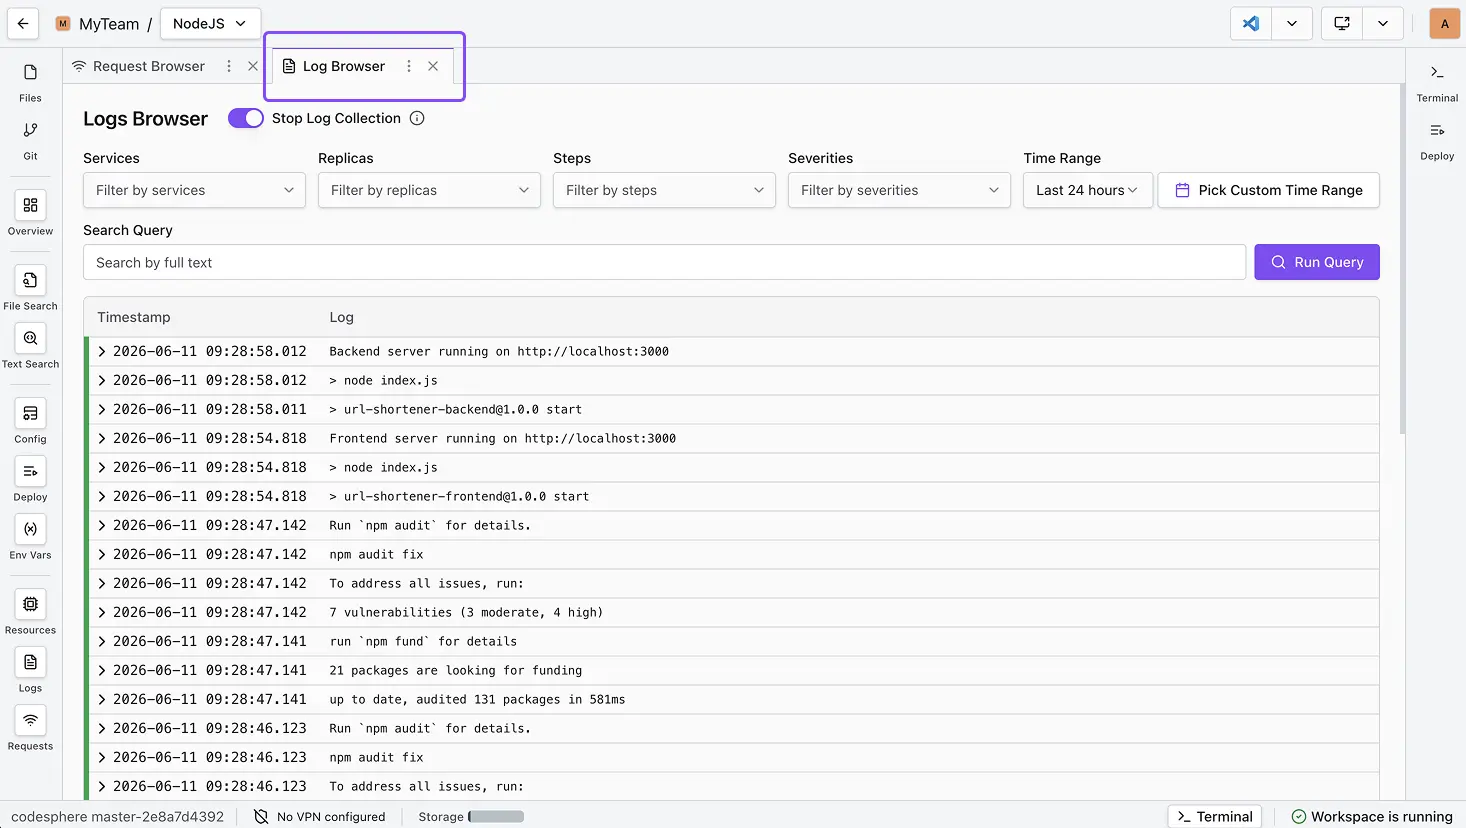
Codesphere will open a new tab in the Log Browser, automatically filtered to the relevant time window and service.
Note on Trace Correlation
To ensure exact 1:1 matching between traces and logs, your application should utilize OpenTelemetry standards. If OpenTelemetry is not detected, the system will fallback to timestamp correlation. While usually accurate, timestamp matching may occasionally surface nearby logs rather than the exact line responsible for the request.
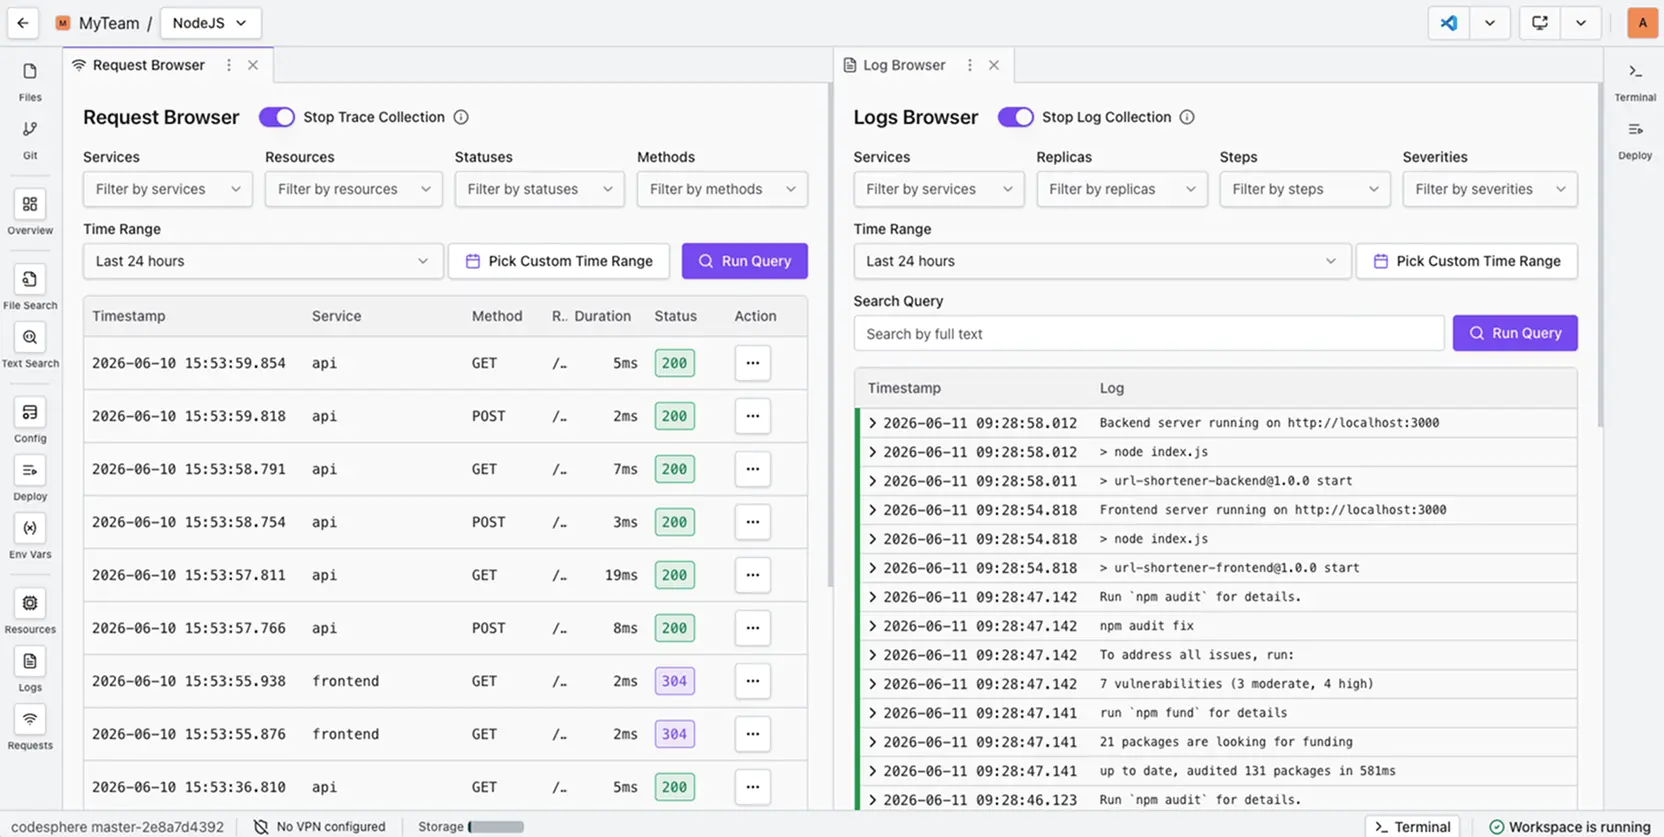
-
Split Screen: To easily debug, view the Log Browser and Request Browser side-by-side. Note: Log collection must be active for the Log Browser to work.
Troubleshooting & Errors
| Error Code/Message | Root Cause | Solution/Example |
|---|---|---|
| Excessive 404s for Static Assets | The request path is case-sensitive, or the static files were not included in the deployment artifact. | Ensure all asset paths are correct. If using case-sensitive servers, ensure path matching is exact. |
| All Requests Show 502 Bad Gateway | The service is not running or the port binding is incorrect. | Immediately check the Service Logs to determine why the application is not listening or why it crashed on startup. |
How Codesphere Collects Traces
Codesphere uses OpenTelemetry (OTel), a standard industry framework, to process data. OTel is the industry standard for vendor-neutral telemetry.
Frequently Asked Questions
-
What is the retention period for logs?
Traces are retained for 14 days. After this period, they are automatically purged from our system. -
How are logs collected?
We utilize OpenTelemetry (OTel). It is a lightweight, industry-standard framework compatible with most modern application stacks. -
Can logs be exported from the Request Browser?
Currently, traces can't be exported directly as a file (e.g.,.csvor.txt). If you need to save log data for long-term auditing, we recommend copying the relevant text segments manually.Have a feature request?
Help us shape the future of Codesphere. You can request new features or vote on the community roadmap at feedback.codesphere.com.
-
What is the difference between Metrics and Traces?
- Key Metrics: Inspect and understand critical request details including end-to-end latency (response time), HTTP status code, and the resource path accessed.
- User Traceability: Correlate specific requests with user sessions or client IP addresses for targeted debugging.
-
Why don’t I see any data in the table?
This message usually appears when no requests match your selected criteria. Adjust your filters or select a different time range to retrieve your trace history.
-
Why can’t I turn on trace collection?
Monitoring needs to be enabled for the Resource Group (Team) first. Only Resource Group (Team) admins can do this. Check if you have member access rather than admin access.